
What follows below is the result of an online discussion I had with psychologists Brent Roberts (BR) and Michael Frank (MF). We discussed scale construction, and particularly, whether items with two response options (i.e., Yes v. No) are good or bad for the reliability and validity of the scale. The answers we came to surprised me--and they might surprise you too!
MK: Twitter recently rolled out a polling feature that allows its users to ask and answer questions of each other. The poll feature allows polling with two possible response options (e.g., Is it Fall? Yes/No). Armed with snark and some basic training in psychometrics and scale construction, I thought it would be fun to pose the following as my first poll:
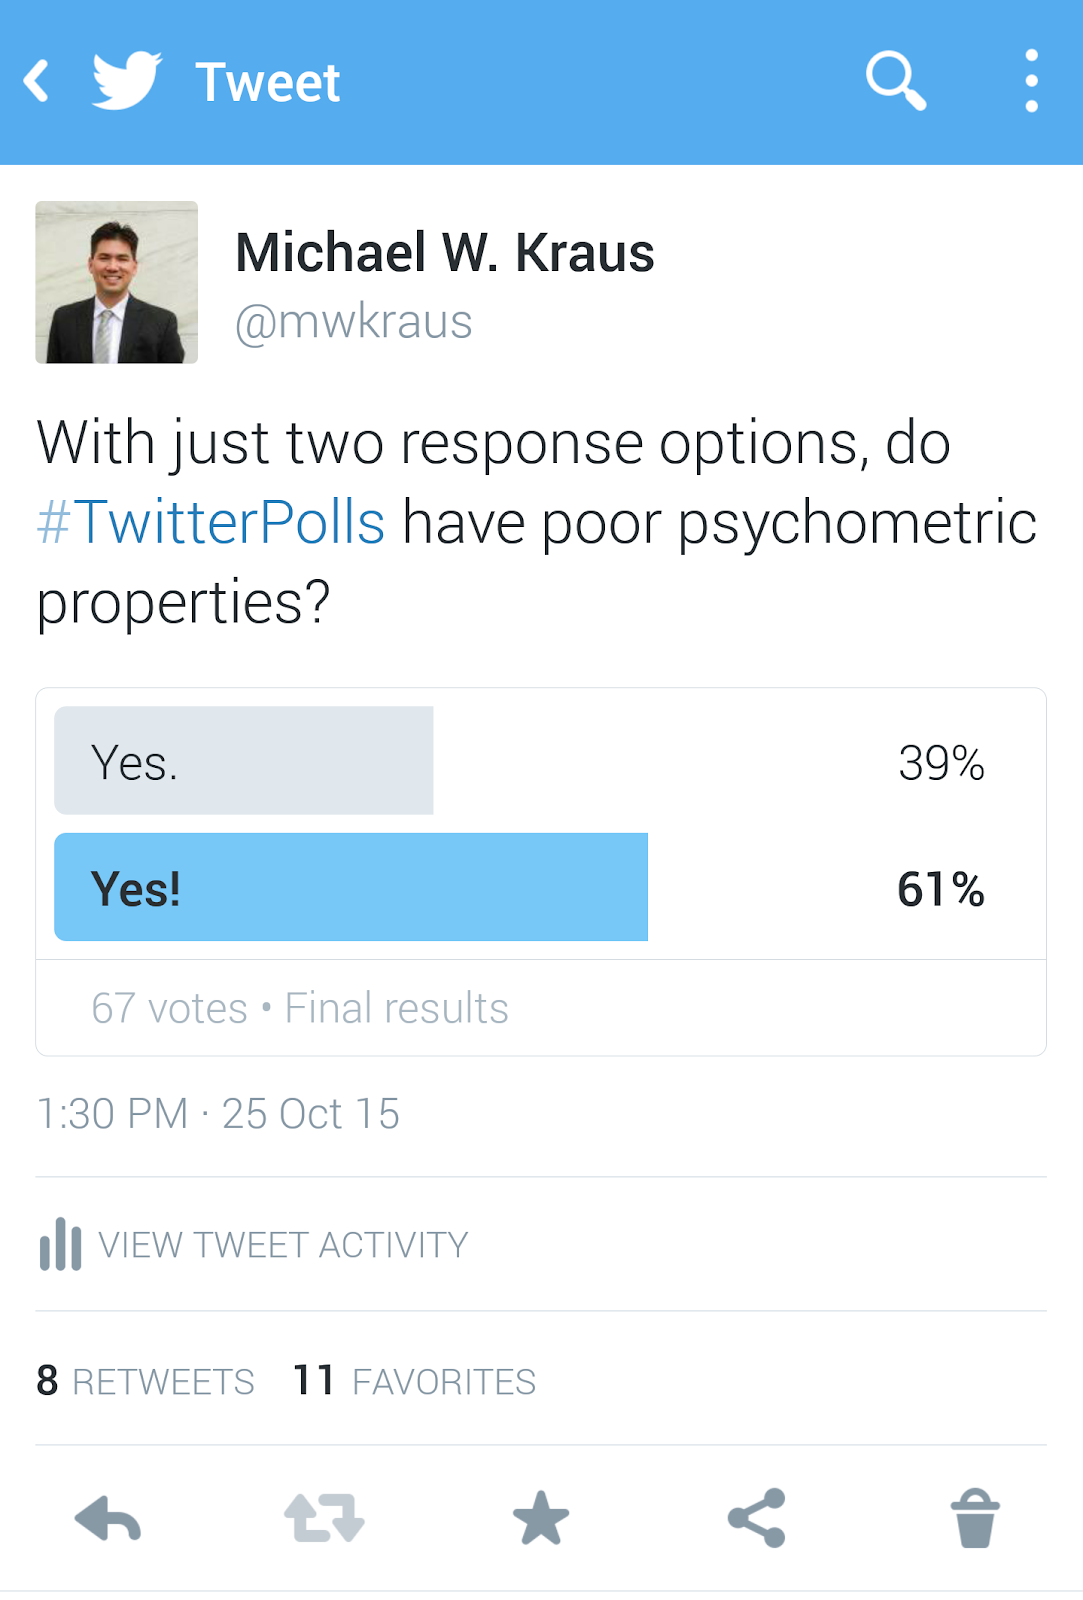
Said training suggests that, all things being equal, some people are more “Yes” or more “No” than others, so having response options that include more variety will capture more of the real variance in participant responses. To put that into an example, if I ask you if you agree with the statement: “I have high self-esteem.” A yes/no two-item response won’t capture all the true variance in people’s responses that might be otherwise captured by six items ranging from strongly disagree to strongly agree. MF/BR, is that how you would characterize your own understanding of psychometrics?
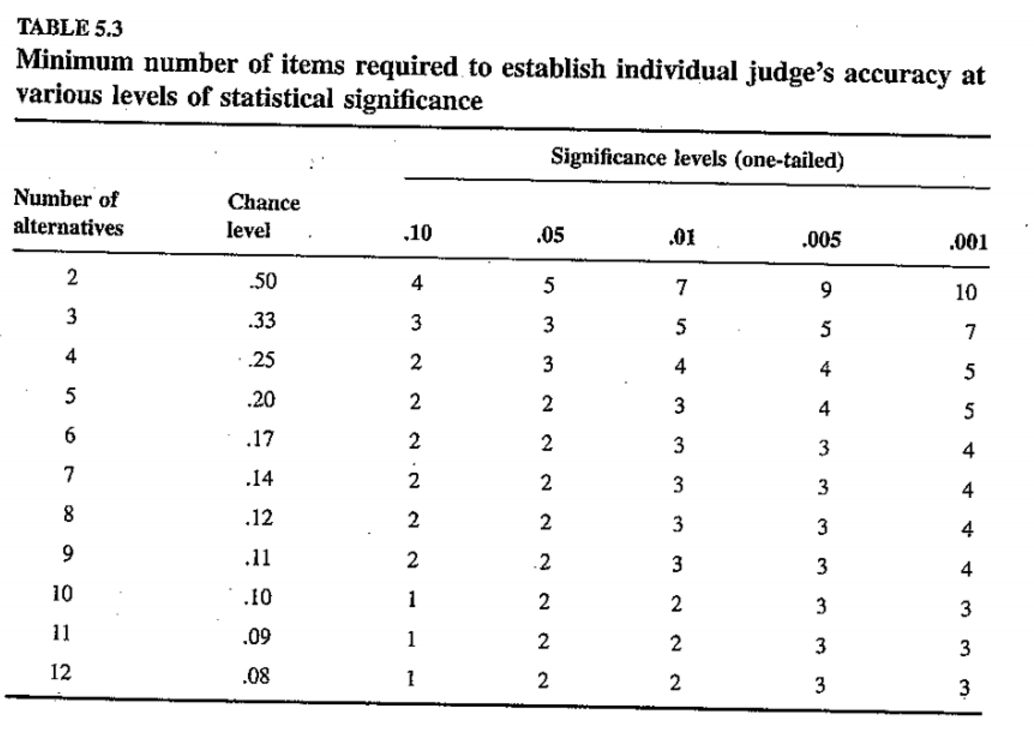
MF: Well, when I’m thinking about dependent variable selection, I tend to start from the idea that the more response options for the participant, the more bits of information are transferred. In a standard two-alternative forced-choice (2AFC) experiment with balanced probabilities, each response provides 1 bit of information. In contrast, a 4AFC provides 2 bits, an 8AFC provides 3, etc. So on this kind of reasoning, the more choices the better, as illustrated by this table from Rosenthal & Rosnow’s classic text:
For example, in one literature I am involved in, people are interested in the ability of adults and kids to associate words and objects in the presence of systematic ambiguity. In these experiments, you see several objects and hear several words, and over time the ideas is that you build up some kind of links between objects and words that are consistently associated. In these experiments, initially people used 2 and 4AFC paradigms. But as the hypotheses about mechanism got more sophisticated, people shifted to using more stringent measures, like a 15AFC, which was argued to provide more information about the underlying representations.
On the other hand, getting more information out of such a measure presumes that there is some underlying signal. In the example above, the presence of this information was relatively likely because participants had been trained on specific associations. In contrast, in the kinds of polls or judgment studies that you’re talking about, it’s more unknown whether participants have the kind of detailed representations that allow for fine-grained judgements. So if you’re asking for a judgment in general (like in #TwitterPolls or classic likert scales), how many alternatives should you use?
MK: Right, most or all of my work (and I imagine a large portion of survey research) involves subjective judgments where it isn’t known exactly how people are making their judgments and what they’d likely be basing those judgments on. So, to reiterate your own question: How many response alternatives should you use?
MF: Turns out there is some research on this question. There’s a very well-cited paper by Preston & Coleman (2000), who ask about service rating scales for restaurants. Not the most psychological example, but it’ll do. They present different participants with different numbers of response categories, ranging from 2 - 101. Here is their primary finding:
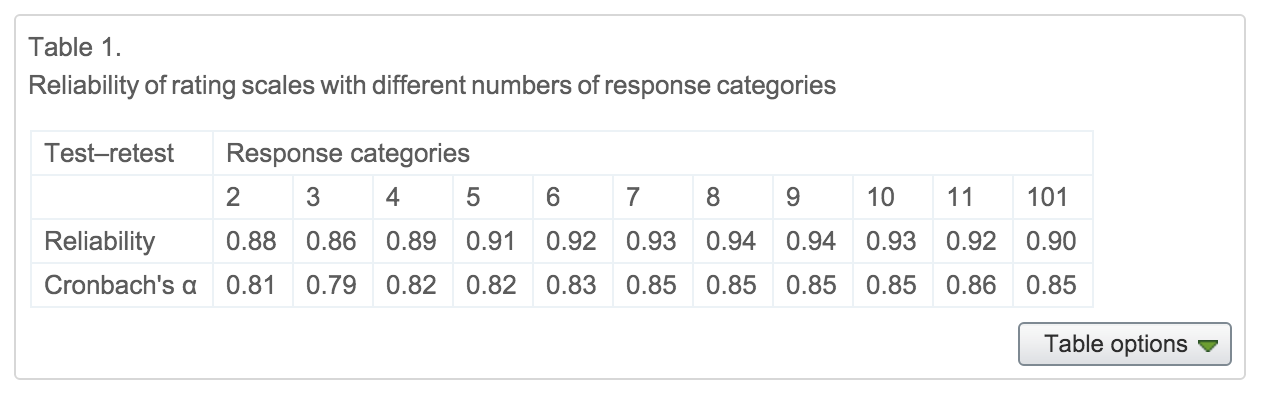
In a nutshell, the reliability is pretty good for two categories, but it gets somewhat better up to about 7-9 options, then goes down somewhat. In addition, scales with more than 7 options are rated as slower and harder to use. Now this doesn’t mean that all psychological constructs have enough resolution to support 7 or 9 different gradations, but at least simple ratings or preference judgements seem like they might.
MK: This is great stuff! But if I’m being completely honest here, I’d say the reliabilities for just two response categories, even though they aren’t as good as they are at 7-9 options, are good enough to use. BR, I’m guessing you agree with this because of your response to my Twitter Poll:
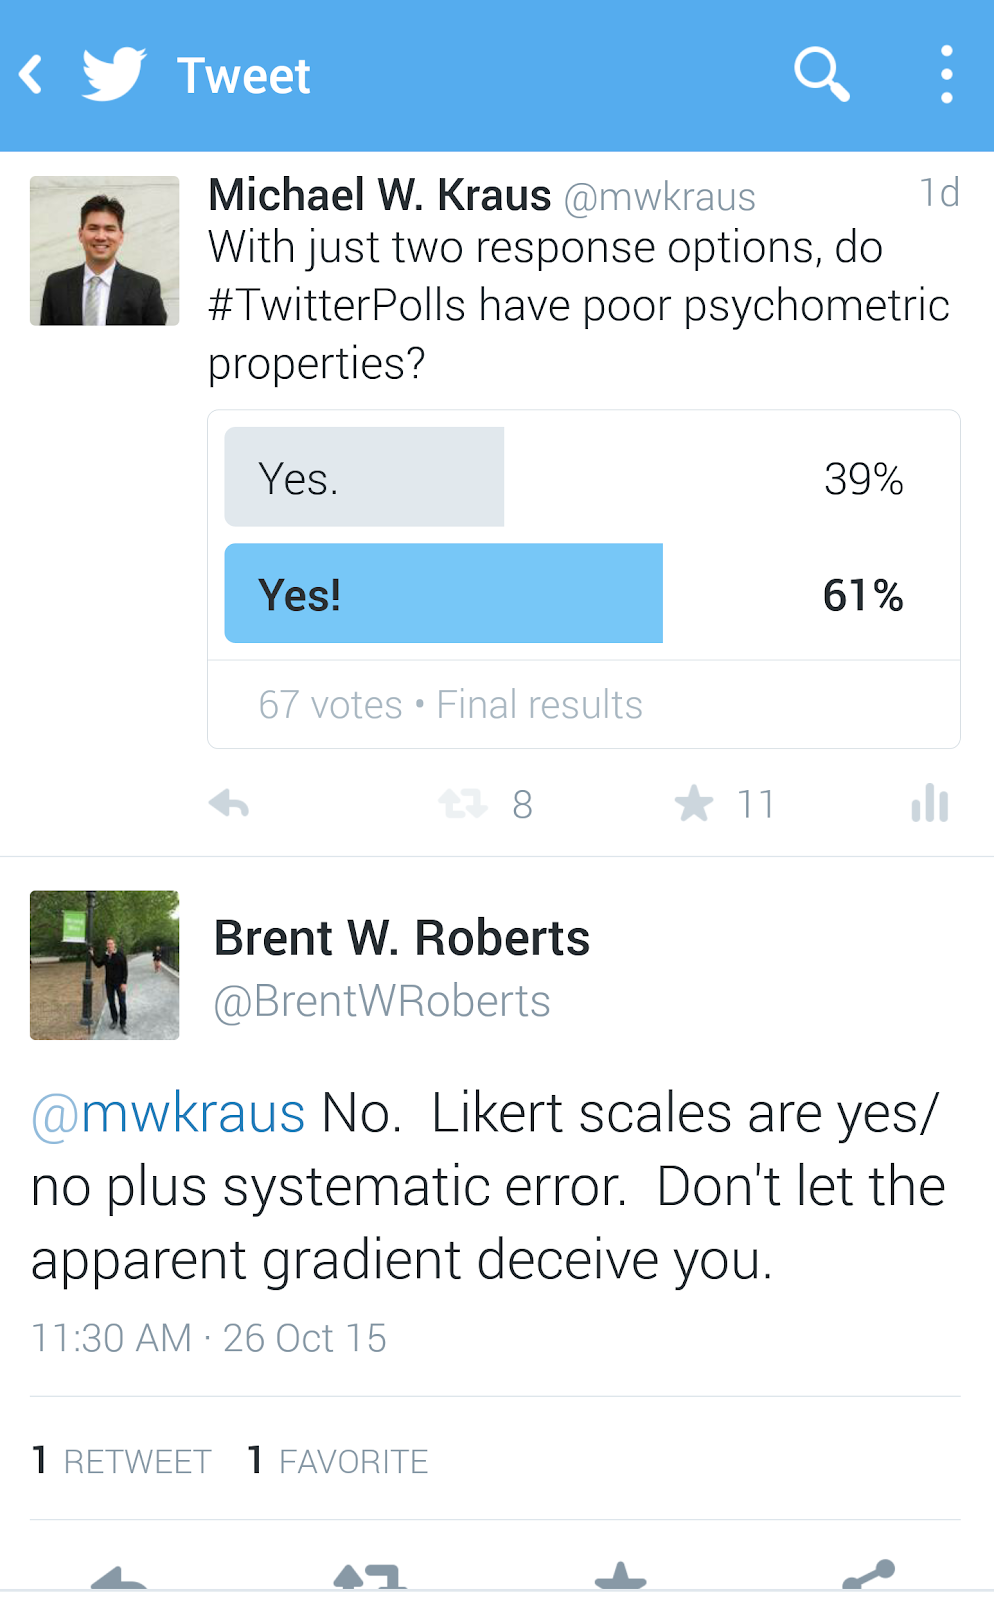
BR: Admittedly, I used to believe that when it came to response formats, more was always better. I mean, we know that dichotomizing continuous variables is bad, so how could it be that a dichotomous rating scale (e.g., yes/no) would be as good if not superior to a 5-point rating scale? Right?
Two things changed my perspective. The first was precipitated by being forced to teach psychometrics, which is minimally on the 5th level of Dante’s Hell teaching-wise. For some odd reason at some point I did a deep dive into the psychometrics of scale response formats and found, much to my surprise, a long and robust history going all they way back to the 1920s. I’ll give two examples. Like the Preston & Colemen (2000) study that Michael cites, some old old literature had done the same thing (god forbid, replication!!!). Here’s a figure showing the test-retest reliability from Matell & Jacoby (1971), where they varied the response options from 2 to 19 on measures of values:

The picture is a little different from the internal consistencies shown in Preston & Colemen (2000), but the message is similar. There is not a lot of difference between 2 and 19. What I really liked about the old school researchers is they cared as much about validity as they did reliability--here’s their figure showing simple concurrent validity of the scales:
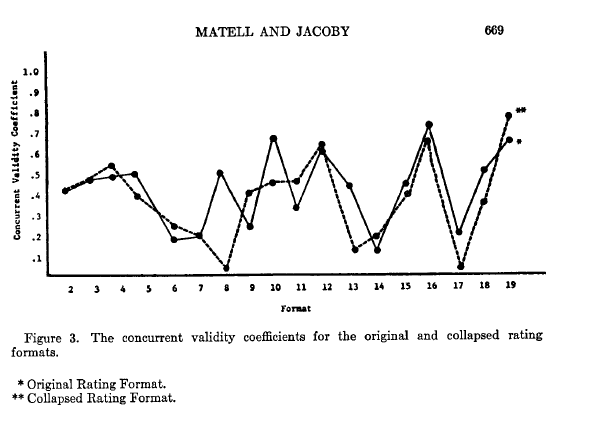
The numbers bounce a bit because of the small samples in each group, but the obvious take away is that there is no linear relation between scale points and validity.
The second example is from Komorita & Graham (1965). These authors studied two scales, the evaluative dimension from the Semantic Differential and the Sociability scale from the California Psychological Inventory. The former is really homogeneous, the latter quite heterogeneous in terms of content. The authors administered 2 and 6 point response formats for both measures. Here is what they found vis a vis internal consistency reliability:
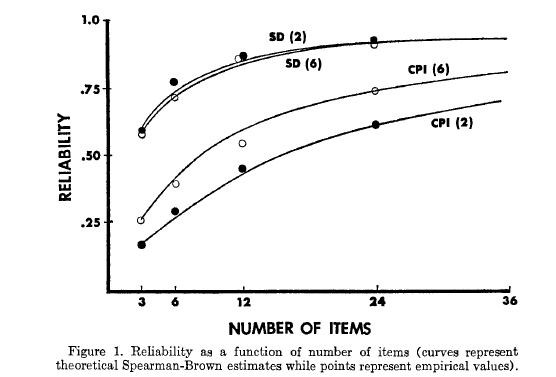
This set of findings is much more interesting. When the measure is homogeneous, the rating format does not matter. When it is heterogeneous, having 6 options leads to better internal consistency. The authors’ discussion is insightful and worth reading, but I’ll just quote them for brevity: “A more plausible explanation, therefore, is that some type of response set such as an “extreme response set” (Cronbach, 1946; 1950) may be operating to increase the reliability of heterogeneous scales. If the reliability of the response set component is greater than the reliability of the content component of the scale, the reliability of the scale will be increased by
increasing the number of scale points.”
Thus, the old-school psychometricians argued that increasing the number of scale point options does not affect test-retest reliability, or validity. It does marginally increase internal consistency, but most likely because of “systematic error” such as, response sets (e.g., consistently using extreme options or not) that add some additional internal consistency to complex constructs.
One interpretation of our modern love of multi-option rating scales is that it leads to better internal consistencies which we all believe to be a good thing. Maybe it isn’t.
MK: I’ve have three reactions to this: First, I’m sorry that you had to teach psychometrics. Second, it’s amazing to me that all this work on scale construction and optimal item amount isn’t more widely known. Third, how come, knowing all this as you do, this is the first time I have heard you favor two-item response options?
BR: You might think that I would have become quite the zealot for yes/no formats after coming across this literature, but you would be wrong. I continued pursuing my research efforts using 4 and 5 point rating scales ad nauseum. Old dogs and new tricks and all of that.
The second experience that has turned me toward using yes/no more often, if not by default, came as a result of working with non-WEIRD [WEIRD = White, Educated, Industrial, Rich, and Democratic] samples and being exposed to some of the newer, more sophisticated approaches to modeling response information in Item Response Theory. For a variety of reasons our research of late has been in samples not typically employed in most of psychology, like children, adolescents, and less literate populations than elite college students. In many of these samples, the standard 5-point likert rating of personality traits tend to blow up (psychometrically speaking). We’ve considered a number of options for simplifying the assessment to make it less problematic for these populations to rate themselves, one of which is to simplify the rating scale to yes/no.
It just so happens that we have been doing some IRT work on an assessment experiment we ran on-line where we randomly assigned people to fill out the NPI in one of three conditions--the traditional paired-comparison, a 5-point likert ratings of all of the stems, and a yes/no rating of all of the NPI item stems (here’s one paper from that effort). I assumed that if we were going to turn to a yes/no format that we would need more items to net the same amount of information as a likert-style rating. So, I asked my colleague and collaborator, Eunike Wetzel, how many items you would need using a yes/no option to get the same amount of test information from a set of likert ratings of the NPI. IRT techniques allow you to estimate how much of the underlying construct a set of items captures via a test information function. What she reported back was surprising and fascinating. You get the same amount of information out of 10 yes/no ratings as you do out of 10 5-point likert scale ratings of the NPI.
So Professor Kraus, this is the source of the pithy comeback to your tweet. It seems to me that there is no dramatic loss of information, reliability, or validity when using 2-point rating scales. If you consider the benefits gained--responses will be a little quicker, fewer response set problems, and the potential to be usable in a wider population, there may be many situations in which a yes/no is just fine. Conversely, we may want to be cautious about the gain in internal consistency reliability we find in highly verbal populations, like college students, because it may arise through response sets and have no relation to validity.
MK: I appreciate this really helpful response (and that you address me so formally). Using a yes/no format has some clear advantages, as it forces people to fall on one side of a scale or the other, is quicker to answer than questions that rely on 4-7 Likert items, and sounds (from your work BF) that it allows scales to hold up better for non-WEIRD populations. MF, what is your reaction to this work?
MF: This is totally fascinating. I definitely see the value of using yes/no in cases where you’re working with non-WEIRD populations. We are just in the middle of constructing an instrument dealing with values and attitudes about parenting and child development and the goal is to be able to survey broader populations than the university-town parents we often talk to. So I am certainly convinced that yes/no is a valuable option for that purpose and will do a pilot comparison shortly.
On the other hand, I do want to push back on the idea that there are never cases where you would want a more graded scale. My collaborators and I have done a bunch of work now using continuous dependent variables to get graded probabilistic judgments. Two examples of this work are Kao et al., (2014) – I’m not an author on that one but I really like it – and Frank & Goodman (2012). To take an example, in the second of those papers we showed people displays with a bunch of shapes (say a blue square, blue circle, and green square) and asked them, if someone used the word “blue,” which shape do you think they would be talking about?
In those cases, using sliders or “betting” measures (asking participants to assign dollar values between 0 and 100) really did seem to provide more information per judgement than other measures. I’ve also experimented with using binary dependent variables in these tasks, and my impression is that they both converge to the same mean, but that the confidence intervals on the binary DV are much larger. In other words, if we hypothesize in these cases that participants really are encoding some sort of continuous probability, then querying it in a continuous way should yield more information.
So Brent, I guess I’m asking you whether you think there is some wiggle room in the results we discussed above – for constructs and participants where scale calibration is a problem and psychological uncertainty is large, we’d want yes/no. But for constructs that are more cognitive in nature, tasks that are more well-specified, and populations that are more used to the experimental format, isn’t it still possible that there’s an information gain for using more fine-grained scales?
BR: Of course there is wiggle room. There are probably vast expanses of space where alternatives are more appropriate. My intention is not to create a new “rule of thumb” where we only use yes/no responses throughout. My intention was simply to point out that our confidence in certain rules of thumb is misplaced. In this case, the assumption that likert scales are always preferably is clearly not the case. On the other hand, there are great examples where a single, graded dimension is preferable--we just had a speaker discussing political orientation which was rated from conservative to moderate to liberal on a 9-point scale. This seems entirely appropriate. And, mind you, I have a nerdly fantasy of someday creating single-item personality Behaviorally Anchored Rating Scales (BARS). These are entirely cool rating scales where the items themselves become anchors on a single dimension. So instead of asking 20 questions about how clean your room is, I would anchor the rating points from “my room is messier than a suitcase packed by a spider monkey on crack” to “my room is so clean they make silicon memory chips there when I’m not in”. Then you could assess the Big Five or the facets of the Big Five with one item each. We can dream can’t we?
MF: Seems like a great dream to me. So - it sounds like if there’s one take-home from this discussion, it’s “don’t always default to the seven-point likert scale.” Sometimes such scales are appropriate and useful, but sometimes you want fewer – and maybe sometimes you’d even want more.
This post also appears on MF's blog "Babies Learning Language" and BR's blog "Espresso!!!! (and personality)"
No comments:
Post a Comment